Two-column page with a table and a formula
What we set
One page. Nothing else to write: the model works from the file.
What came out, untouched
Busy-hour traffic forecasting for mobile cells
Technical note 7, revision 3 · October 2026
1. Problem
An operator plans capacity per cell from the busy-hour downlink volume. The busy hour is the sixty-minute window of a day with the highest traffic; for a cell it moves with the week and with the season. We forecast the 95th percentile of the daily busy-hour volume over the next 13 weeks from 52 weeks of history, per cell and per band.
2. Features
Only past-window features are used: the trailing 4-, 8- and 13-week medians, the week-of-year, the share of 5G-capable devices, and the PRB utilisation at the busy hour. Labels come from the future window only, and validation is out of time: the last 13 weeks are held out.
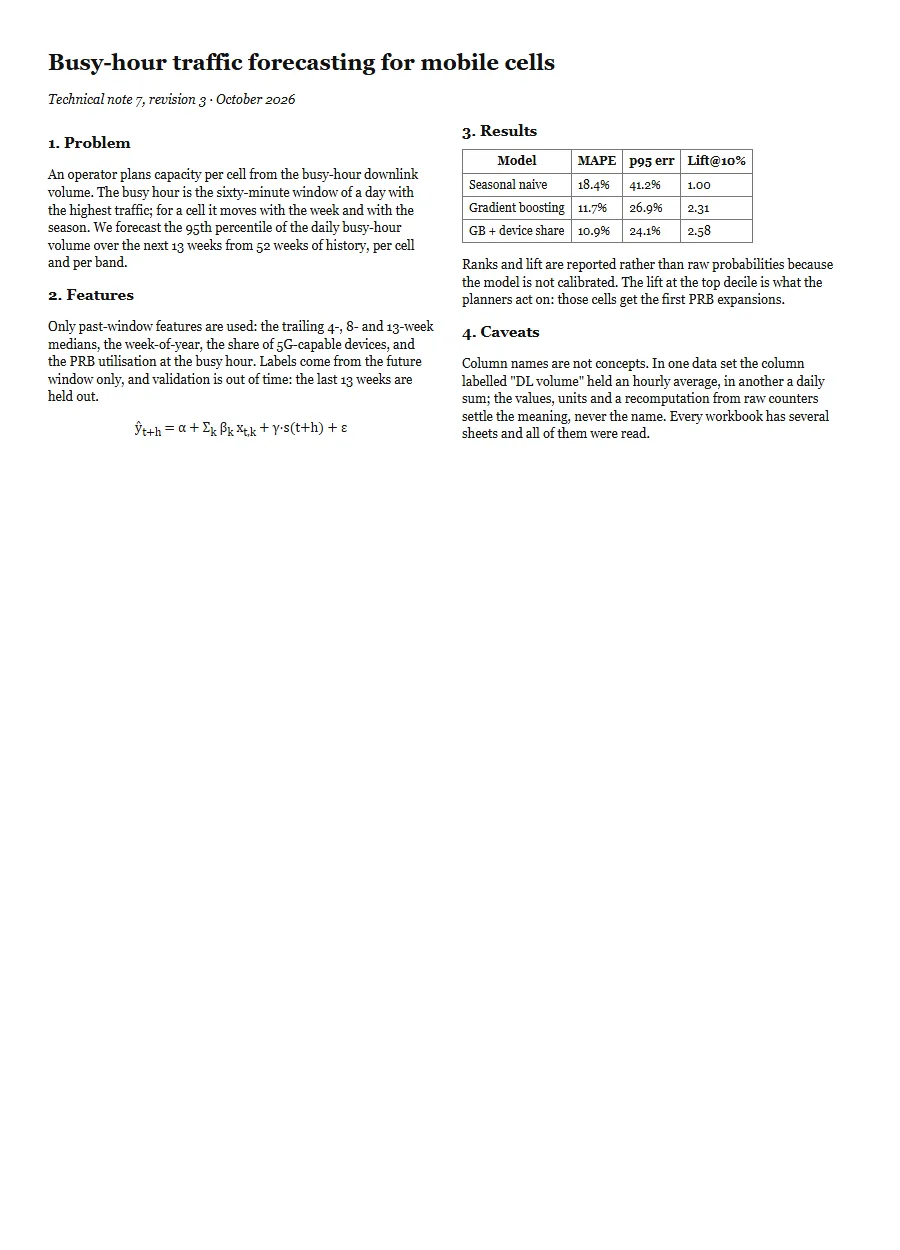
\hat{y}_{t+h} = \alpha + \Sigma_k \beta_k x_{t,k} + \gamma \cdot s(t+h) + \varepsilon3. Results
| Model | MAPE | p95 err | Lift@10% |
|---|---|---|---|
| Seasonal naive | 18.4% | 41.2% | 1.00 |
| Gradient boosting | 11.7% | 26.9% | 2.31 |
| GB + device share | 10.9% | 24.1% | 2.58 |
Ranks and lift are reported rather than raw probabilities because the model is not calibrated. The lift at the top decile is what the planners act on: those cells get the first PRB expansions.
4. Caveats
Column names are not concepts. In one data set the column labelled "DL volume" held an hourly average, in another a daily sum; the values, units and a recomputation from raw counters settle the meaning, never the name. Every workbook has several sheets and all of them were read.
9 s on our RTX 4060 1 credit ($0.10) · One page
Try it with your own file