Upload an image and ask. Qwen3-VL writes alt text and captions, pulls invoice fields into JSON, and reads charts: series, events and peak values.
What you can do
3 real jobs, run on our GPU
Each example is a real run on our GPU: what went in, the exact instruction, and the result exactly as the model made it. Pick one to see it, then start from the same instruction.
Alt text and SEO caption for a wallpaper
1What went in
2What we asked
Write (1) an alt text of at most 125 characters and (2) a two-sentence SEO caption for this wallpaper. Do not mention people.
3What came out, untouched
(1)
Snowy mountain valley under a starry sky with Milky Way arching overhead, illuminated by a warm campfire below.

(2)
Stunning winter night in the mountains, where the Milky Way glows above a cozy campfire. Perfect celestial wallpaper for star lovers and nature enthusiasts.
7 s on our RTX 40601 credit ($0.10) · One question
Invoice fields to JSON
1What went in
2What we asked
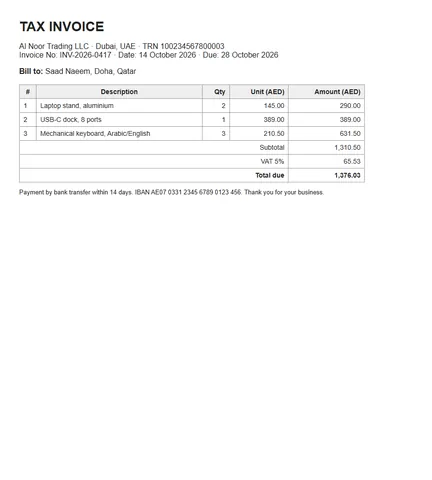
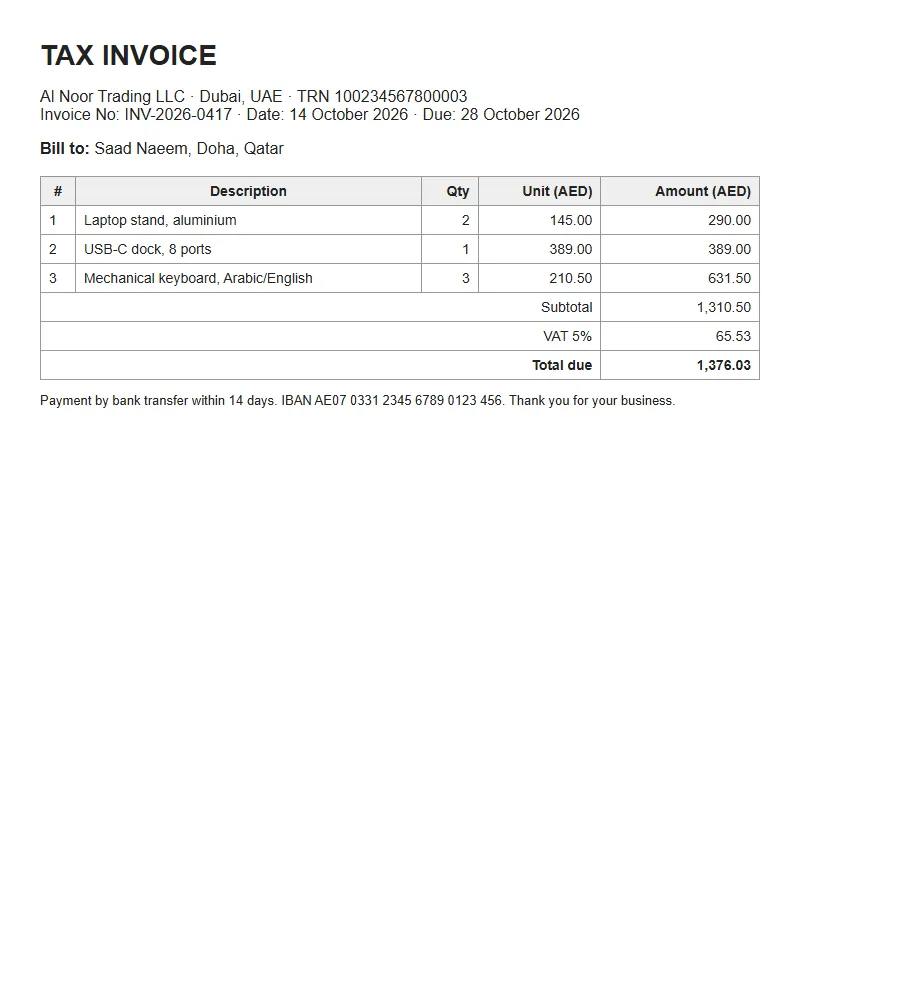
From this invoice answer: invoice number, invoice date, due date, the three line items with amounts, subtotal, VAT amount and rate, total due, and the IBAN. Reply as a JSON object.
3What came out, untouched
Returned as JSON, shown as a table
Invoice number
INV-2026-0417
Invoice date
14 October 2026
Due date
28 October 2026
Laptop stand, aluminium
290
USB-C dock, 8 ports
389
Mechanical keyboard, Arabic/English
631.50
Subtotal
1310.50
VAT rate
5%
VAT amount
65.53
Total due
1376.03
IBAN
AE07 0331 2345 6789 0123 456
13 s on our RTX 40601 credit ($0.10) · One question
Reading a traffic chart
1What went in
2What we asked
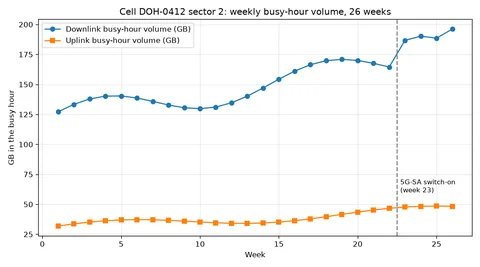
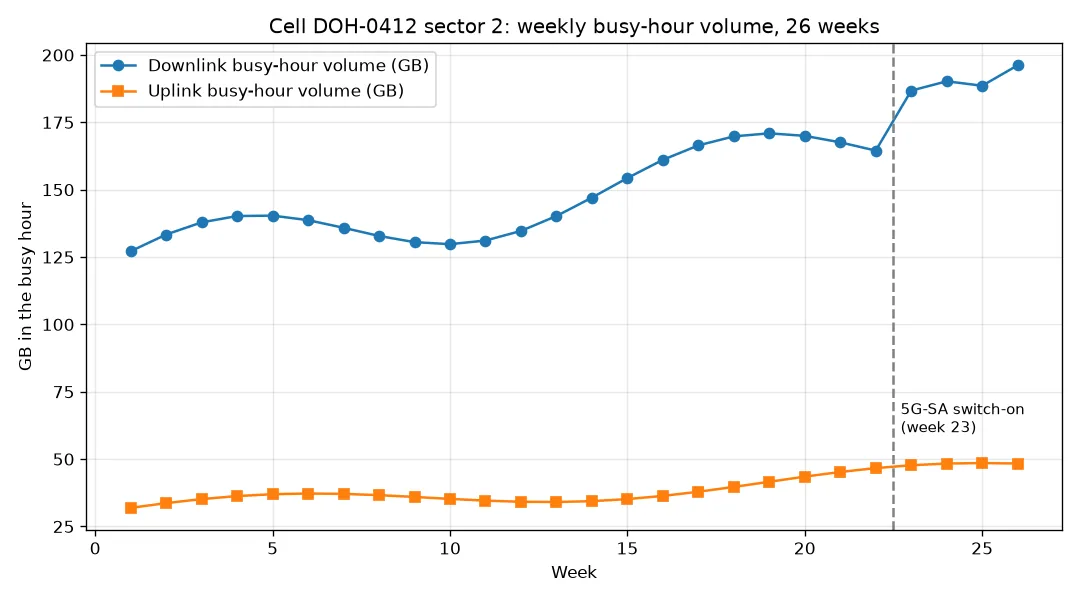
Describe what this chart shows: the two series, the overall trend, what happens around the dashed line, the approximate peak value of the downlink series and the week it occurs. Then give one sentence a network planner would say about it.
3What came out, untouched
This chart displays the weekly busy-hour traffic volume (in GB) for the downlink (blue) and uplink (orange) traffic of Cell DOH-0412, Sector 2, over 26 weeks. The downlink volume steadily increases from ~125 GB to a peak of ~195 GB around week 26, while the uplink volume grows more slowly, leveling off near 50 GB. A significant change occurs around week 23, marked by a dashed line and labeled “5G-SA switch-on,” where the downlink volume sharply accelerates upward, indicating a major traffic surge following the 5G deployment. The uplink volume remains relatively flat and low throughout.

One sentence a network planner would say: “The 5G-SA switch-on in week 23 triggered a dramatic spike in downlink traffic, confirming the cell is now handling a massive new 5G user load — we’ll need to plan for this sustained high volume.”
12 s on our RTX 40601 credit ($0.10) · One question
Works well for
Alt text for accessibility
SEO captions for images and wallpapers
Invoice and receipt fields to JSON
Reading a chart's trend and peak
Describing a photo for a listing
Check before you rely on it
Chart values are read approximately, not to the decimal.
May add interpretation beyond the data (the chart answer called it 'a massive new 5G user load').
One image per question.
Gallery: real results from our GPU
3 examples from our own runs, with the times we measured. Open "Prompt and settings we used" under any of them for the exact input.
(1)
Snowy mountain valley under a starry sky with Milky Way arching overhead, illuminated by a warm campfire below.

(2)
Stunning winter night in the mountains, where the Milky Way glows above a cozy campfire. Perfect celestial wallpaper for star lovers and nature enthusiasts.
Alt text and SEO caption for a wallpaper
Accurate and concise, nothing invented.
GPU time
7 s
Prompt and settings we used
The picture that went in
Prompt
Write (1) an alt text of at most 125 characters and (2) a two-sentence SEO caption for this wallpaper. Do not mention people.
Every value exact: number, dates, three items, subtotal, VAT, total and IBAN.
GPU time
13 s
Prompt and settings we used
The picture that went in
Prompt
From this invoice answer: invoice number, invoice date, due date, the three line items with amounts, subtotal, VAT amount and rate, total due, and the IBAN. Reply as a JSON object.
Model
Qwen3-VL 8B
This chart displays the weekly busy-hour traffic volume (in GB) for the downlink (blue) and uplink (orange) traffic of Cell DOH-0412, Sector 2, over 26 weeks. The downlink volume steadily increases from ~125 GB to a peak of ~195 GB around week 26, while the uplink volume grows more slowly, leveling off near 50 GB. A significant change occurs around week 23, marked by a dashed line and labeled “5G-SA switch-on,” where the downlink volume sharply accelerates upward, indicating a major traffic surge following the 5G deployment. The uplink volume remains relatively flat and low throughout.

One sentence a network planner would say: “The 5G-SA switch-on in week 23 triggered a dramatic spike in downlink traffic, confirming the cell is now handling a massive new 5G user load — we’ll need to plan for this sustained high volume.”
Reading a traffic chart
Legend, the week-23 5G switch-on and the ~195 GB peak all right; the planner sentence adds its own interpretation.
GPU time
12 s
Prompt and settings we used
The picture that went in
Prompt
Describe what this chart shows: the two series, the overall trend, what happens around the dashed line, the approximate peak value of the downlink series and the week it occurs. Then give one sentence a network planner would say about it.
Model
Qwen3-VL 8B
Get the best result
The prompt and the model decide the output; bigger models and settings cost more credits. These notes come from what worked, and what did not, in our runs.
Do
List exactly the fields you want ('invoice number, dates, line items, VAT, total, IBAN, as JSON'): the invoice trial returned every value exact.
Give limits for alt text ('at most 125 characters'); it kept to them.
Ask what happens at a marked event on a chart: it read the 5G switch-on at week 23 and the peak correctly.
Avoid
Upload tiny or blurred images; the trial inputs were 900-1920 px.
Rely on exact readings between gridlines: values come back as approximations (~195 GB).
Cost, quality and time
Times are end to end on our GPU (an RTX 4060 Laptop GPU, 8 GB), model loading included, before any jobs ahead of yours. "Estimate" marks an option we have not measured yet.
Option
Credits
Typical time
Slowest seen
What to expect
One questionRecommended
1
41 s
42 s3 runs
Measured: 6.8-12.9 s per answer plus 29 s model load.
Combine with other tools
Step-by-step recipes that use Ask about an image with other studio tools, with the credits each step costs.
Accepts: Alt text, Caption, Invoice to JSON, Read a chart, Ask a question.
Your question (optional)
Accepts: 5-1000 characters.
Create
You answer for your prompt and your choice of model and settings; the safety filter still checks every job, and a refused prompt costs nothing.
1 creditunder a minute on our GPU, plus any jobs ahead
You'll have 7 days to download it; then it's deleted.
Checking your account…
Results are kept 7 days. Credits come back only if the job fails or never starts.
The line right now
Reading the line…
Credits are held when you send a job and spent when the result is ready. They come back automatically if the job fails, is refused or has not started within 24 hours. Results are kept 7 days, or 48 hours after your first download, then deleted; a result that expires unused is not refunded. Pricing and refunds
Frequently asked questions
Can it fill a spreadsheet from invoices?
Ask for JSON with named fields; paste the result into your sheet. One invoice per job.
Will alt text be accurate?
In our trial it was accurate and invented nothing. Read it before publishing.
Can it read Arabic text in images?
Not tested yet; use the free Arabic OCR for Arabic text.
How long does it take?
Under a minute of GPU time including loading the model.
Is this the same as Document to text?
No: Document to text copies a whole page; this answers questions about any picture.